Back
User persona poster
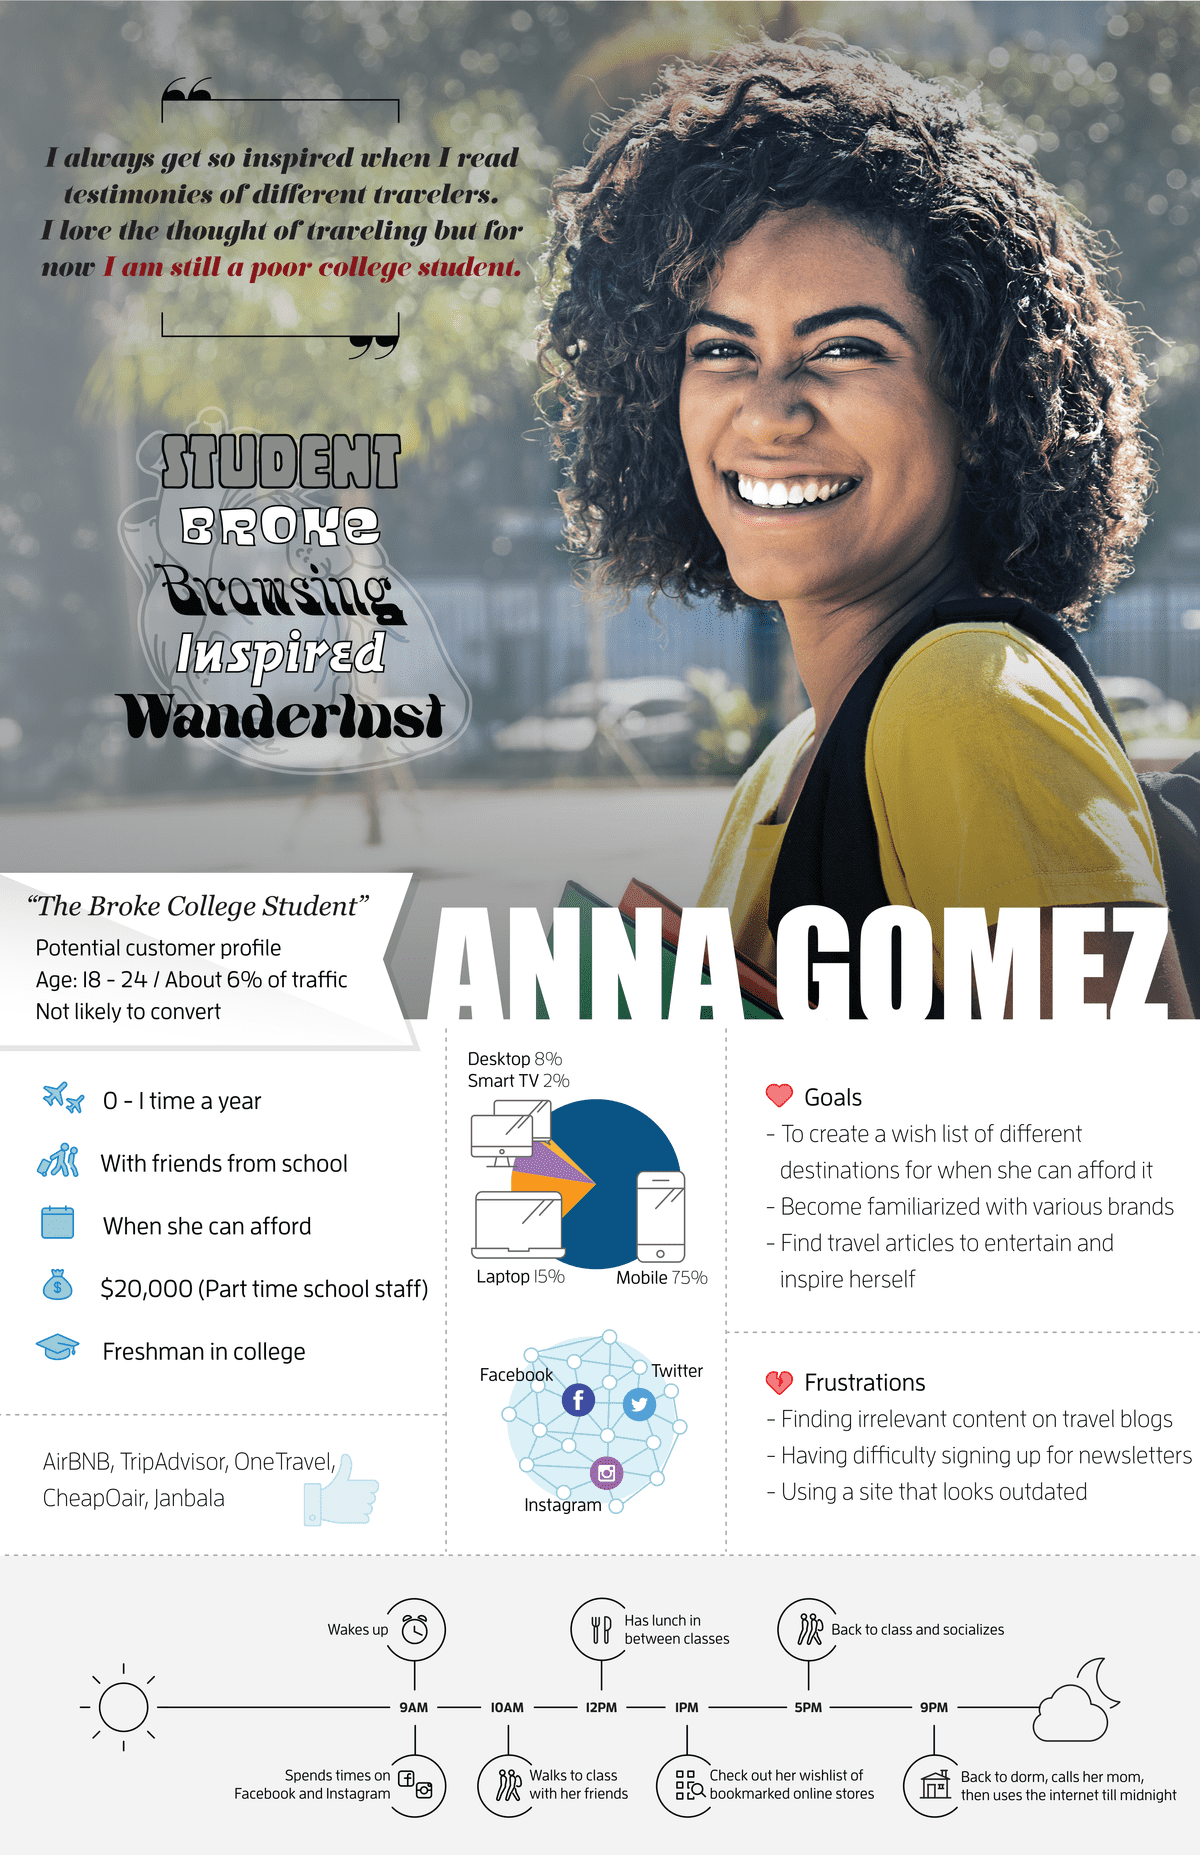
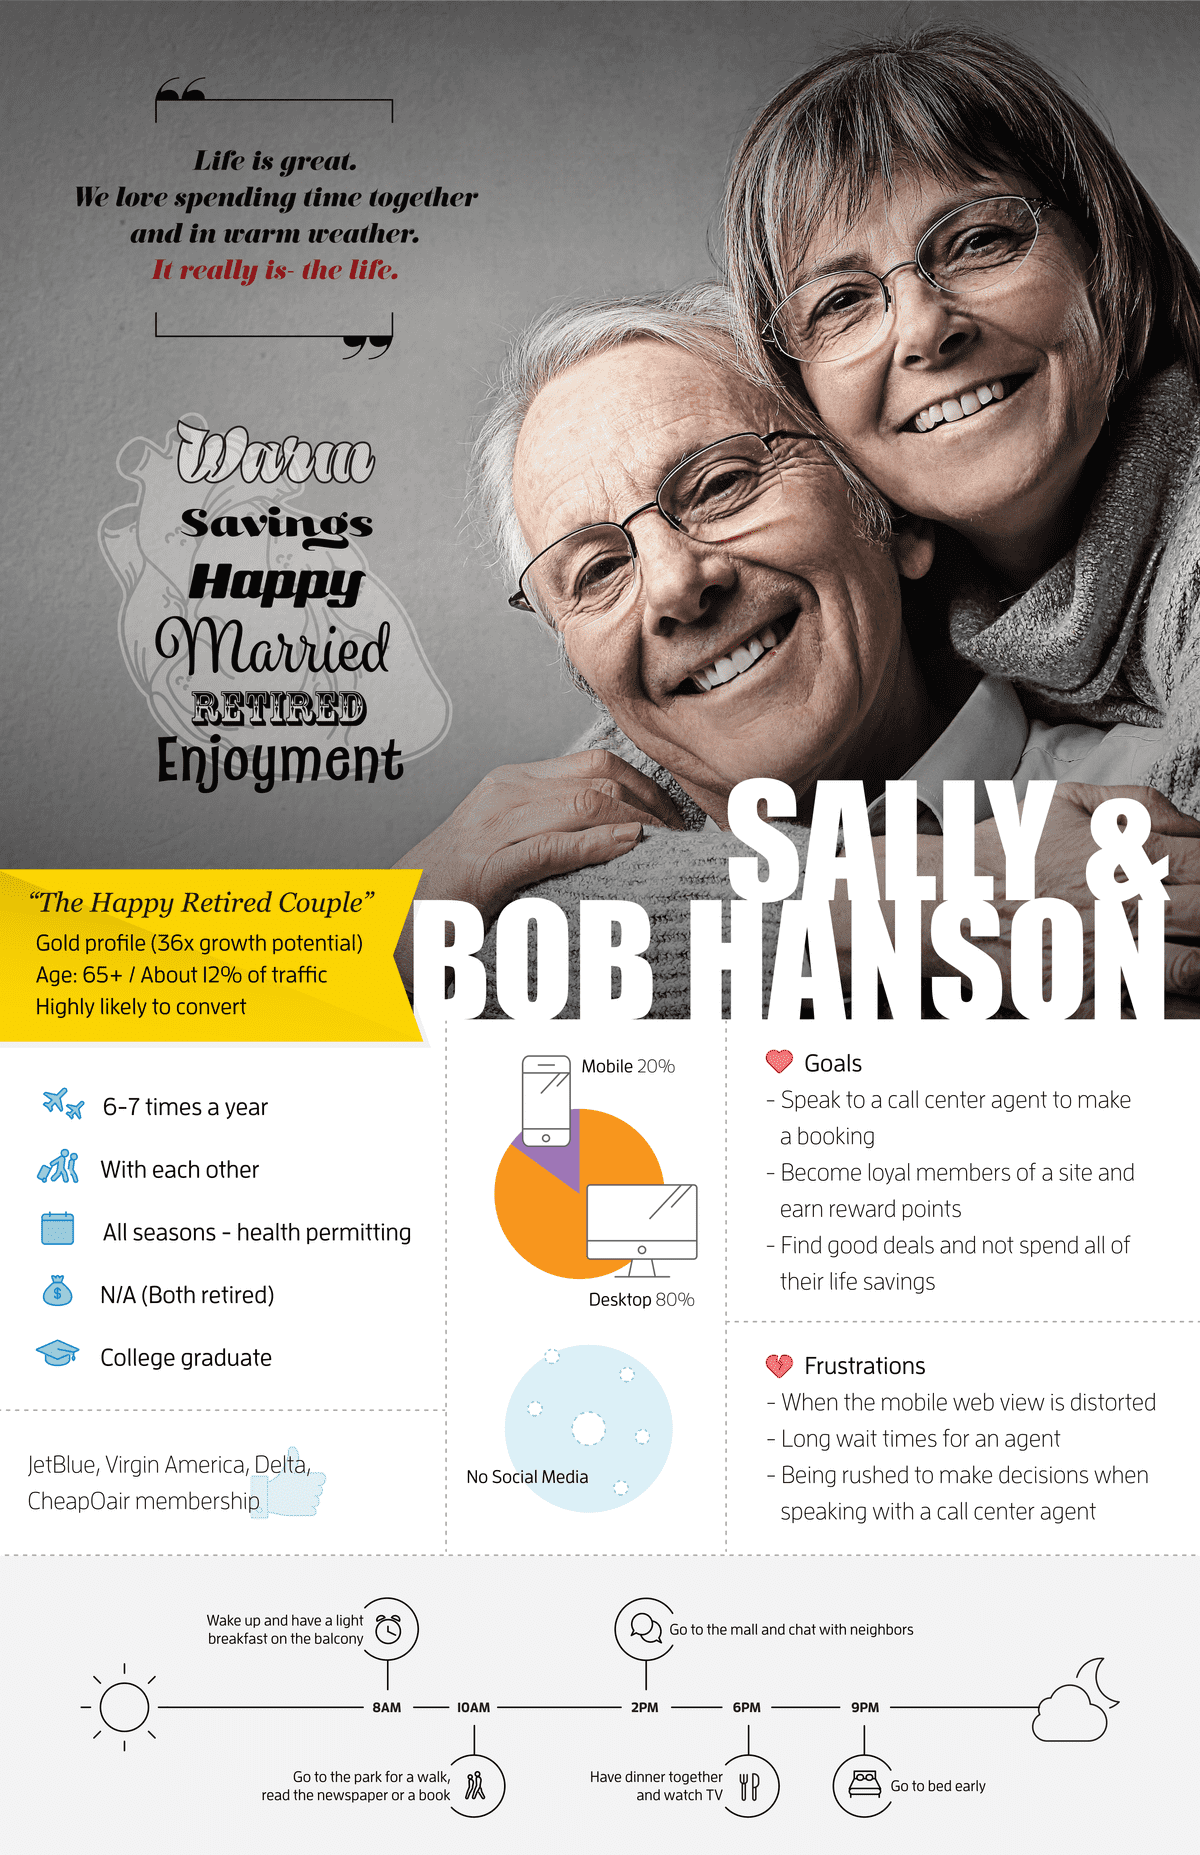
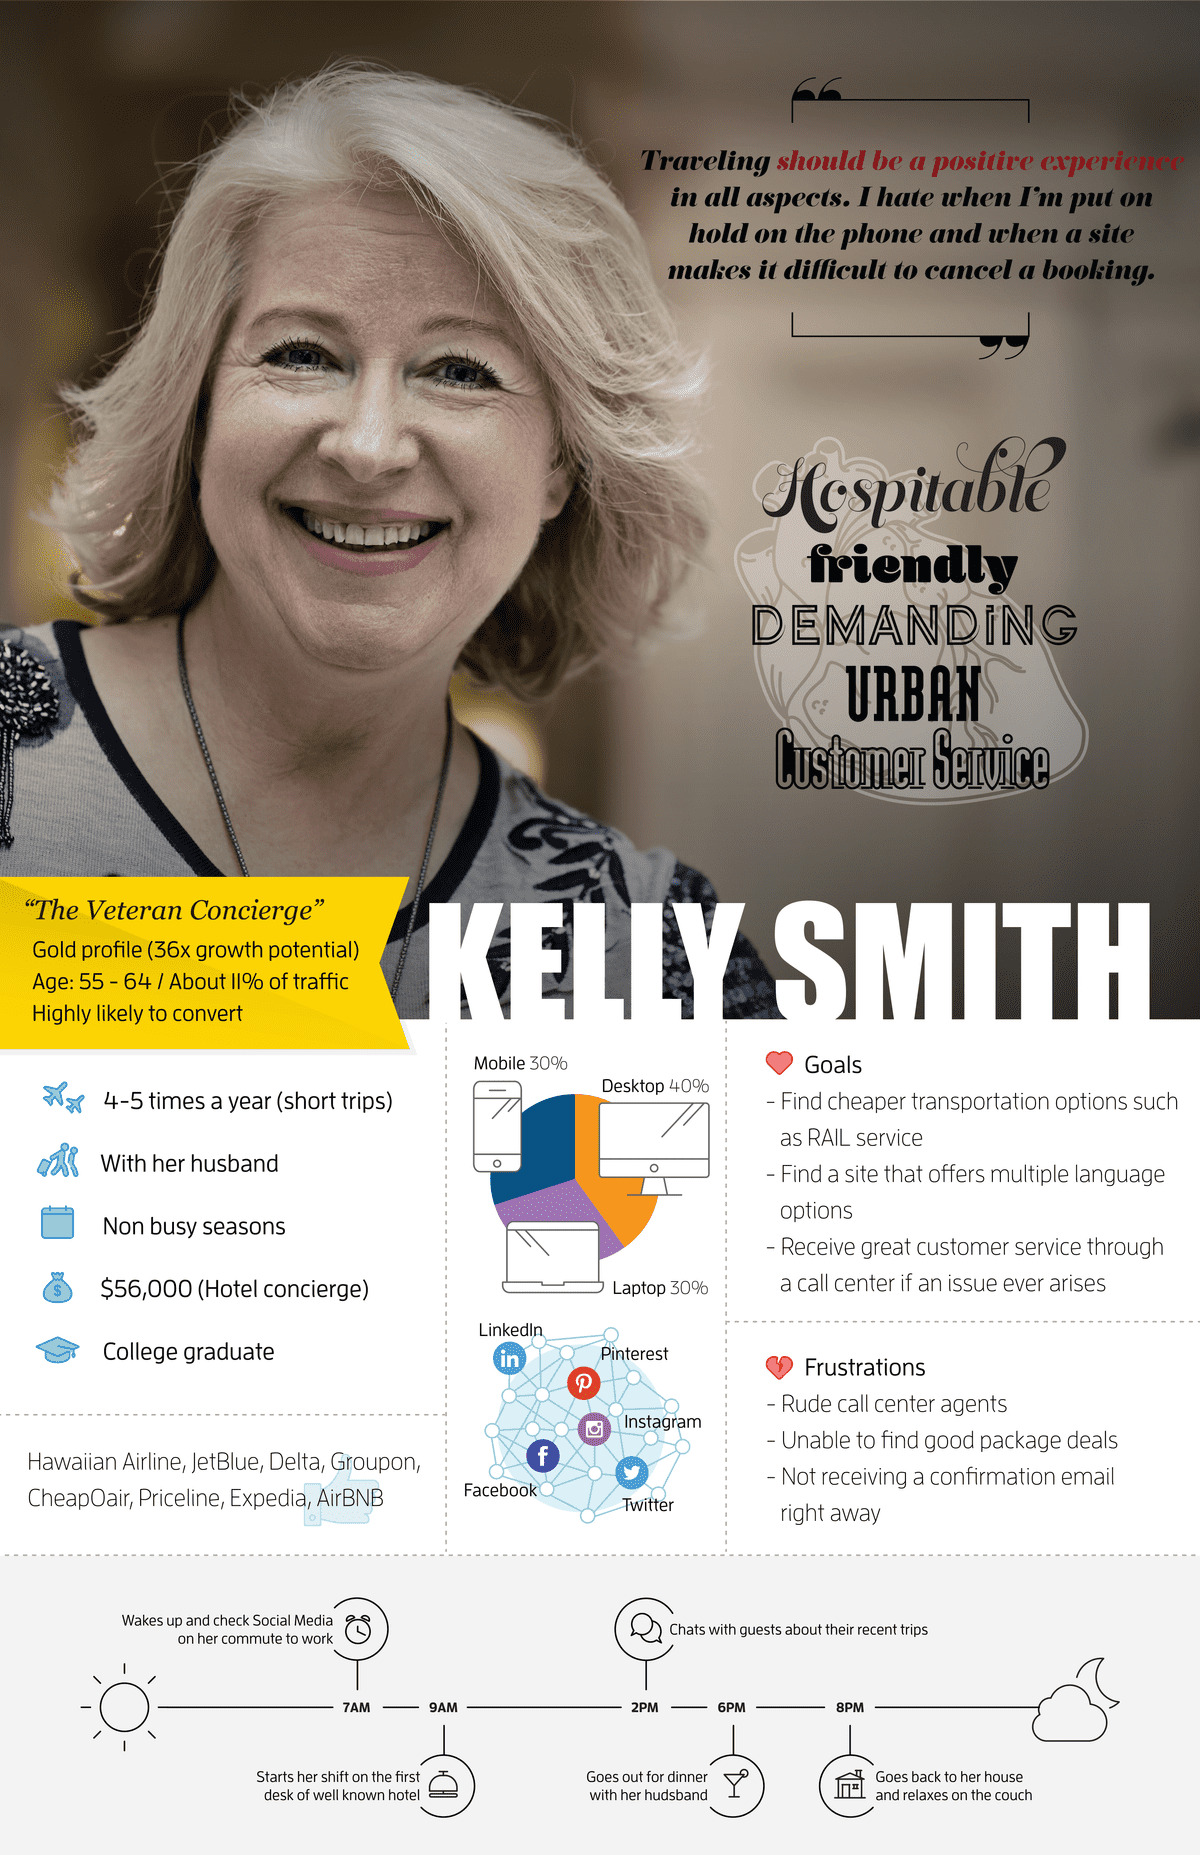
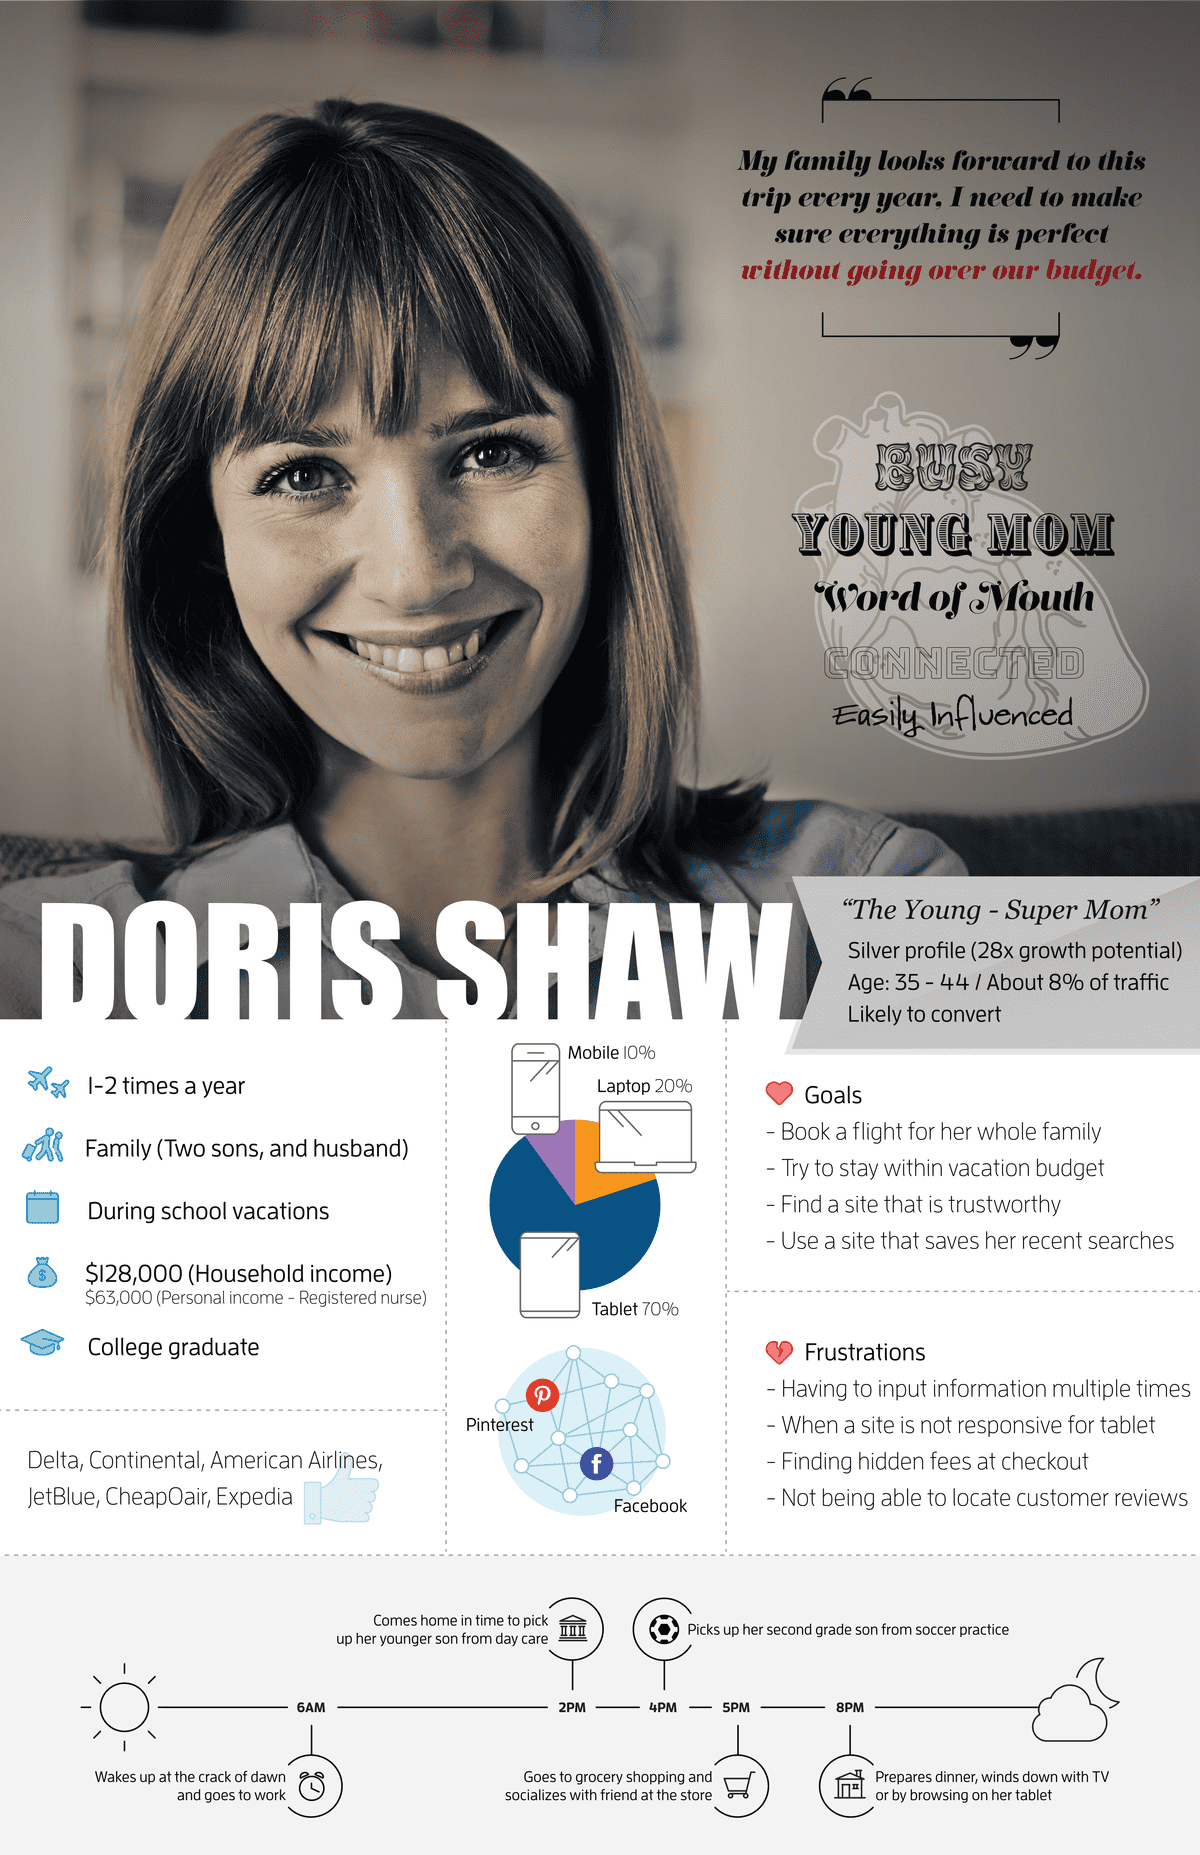
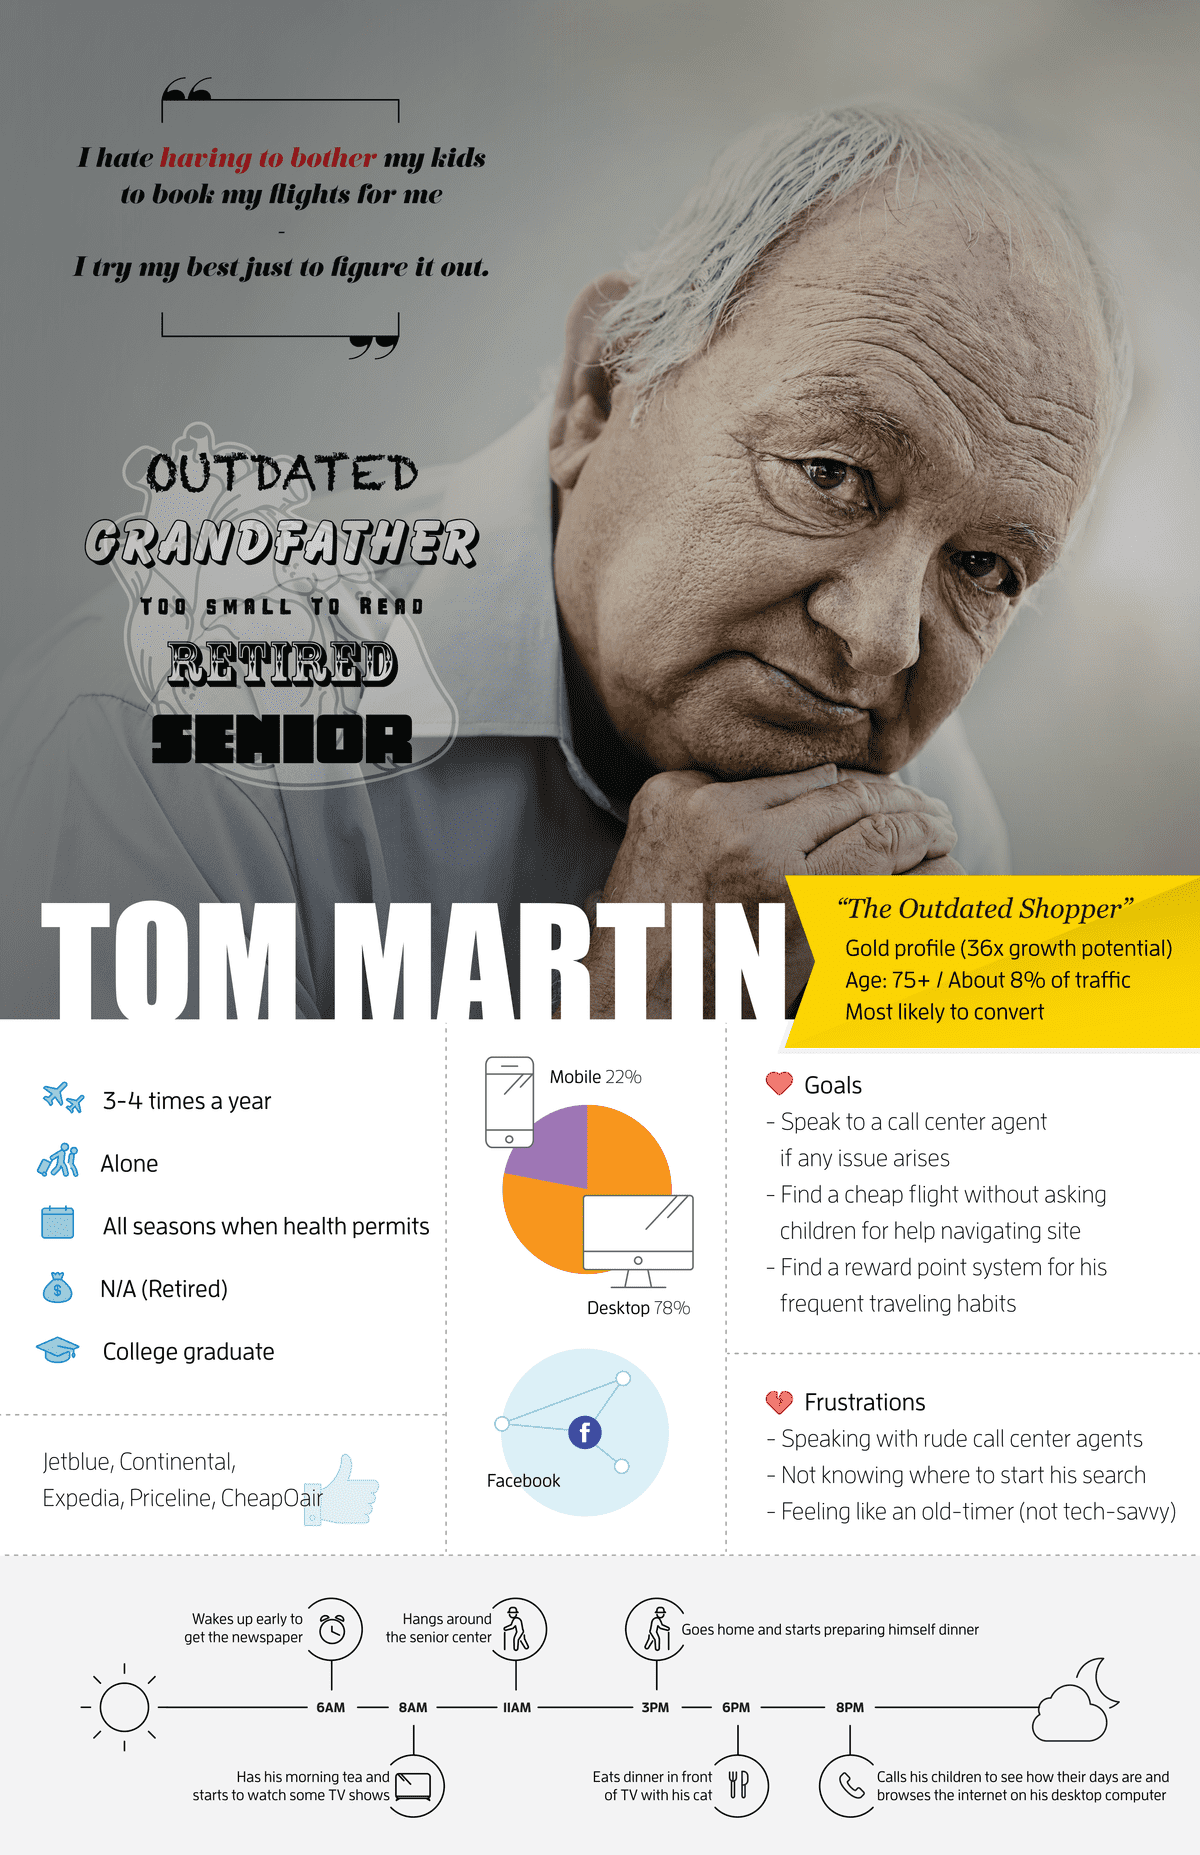
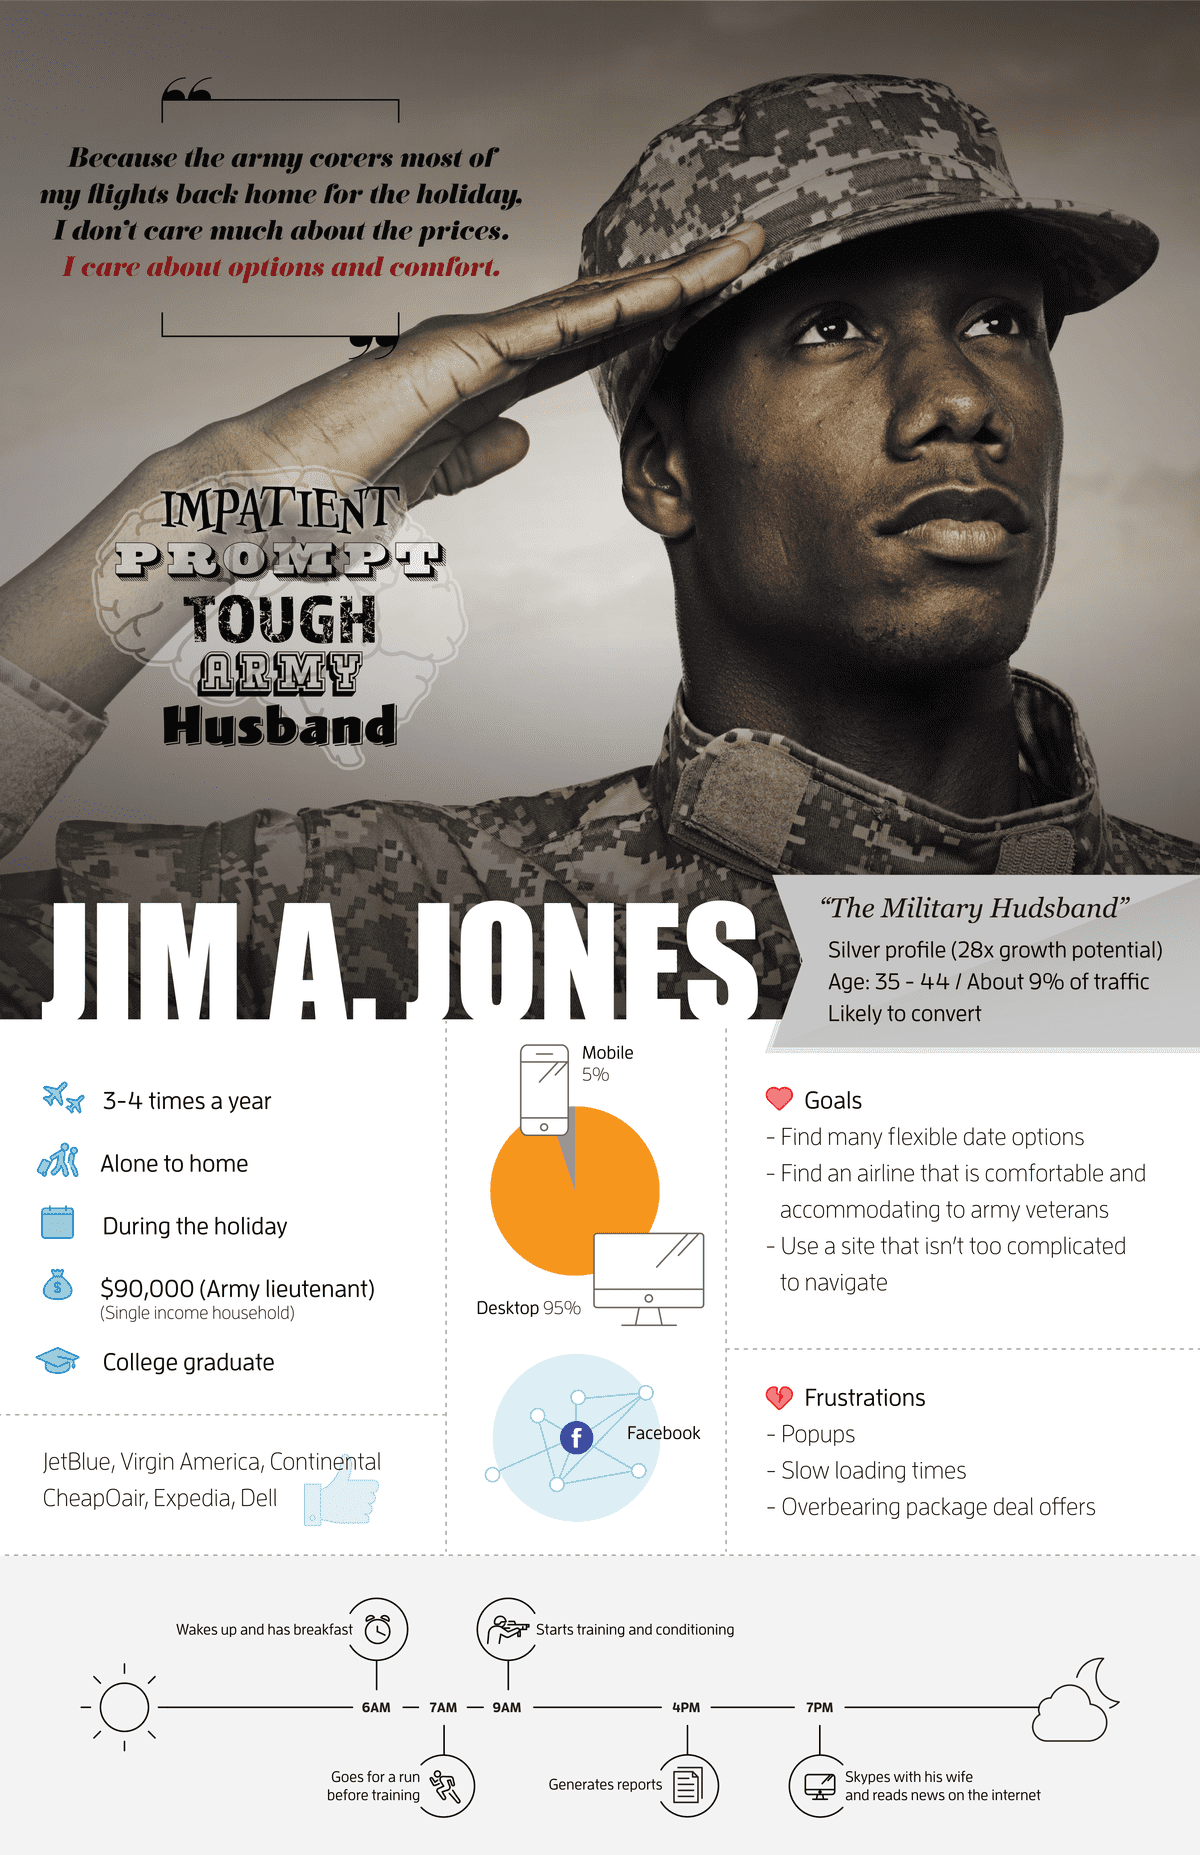
Analyze and visualize consumer data to build a group of user persona profiles
Project process
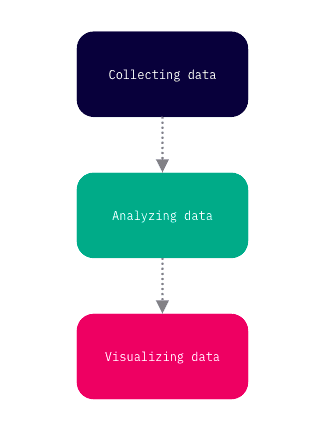
- Collecting consumer data
-
- External tools: CRM data collection, traffic analysis
- Internal mechanism: feedback collection, booking data, user interview
- Data analysis
-
- Sample size determination to segmentize consumer profiles
- Hypothesis testing/interview to breakdown behavior
- Data visualization
-
- Chart, illustration, and iconography
Visualizing information
- Supplementary visual
-
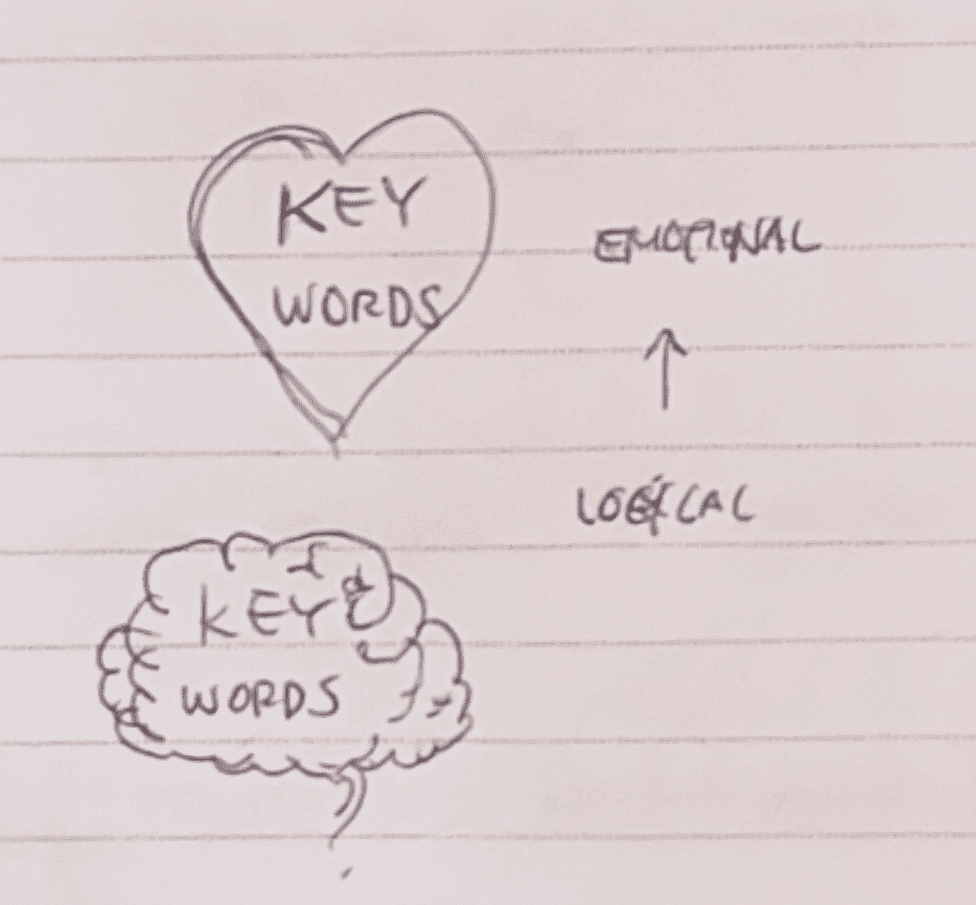
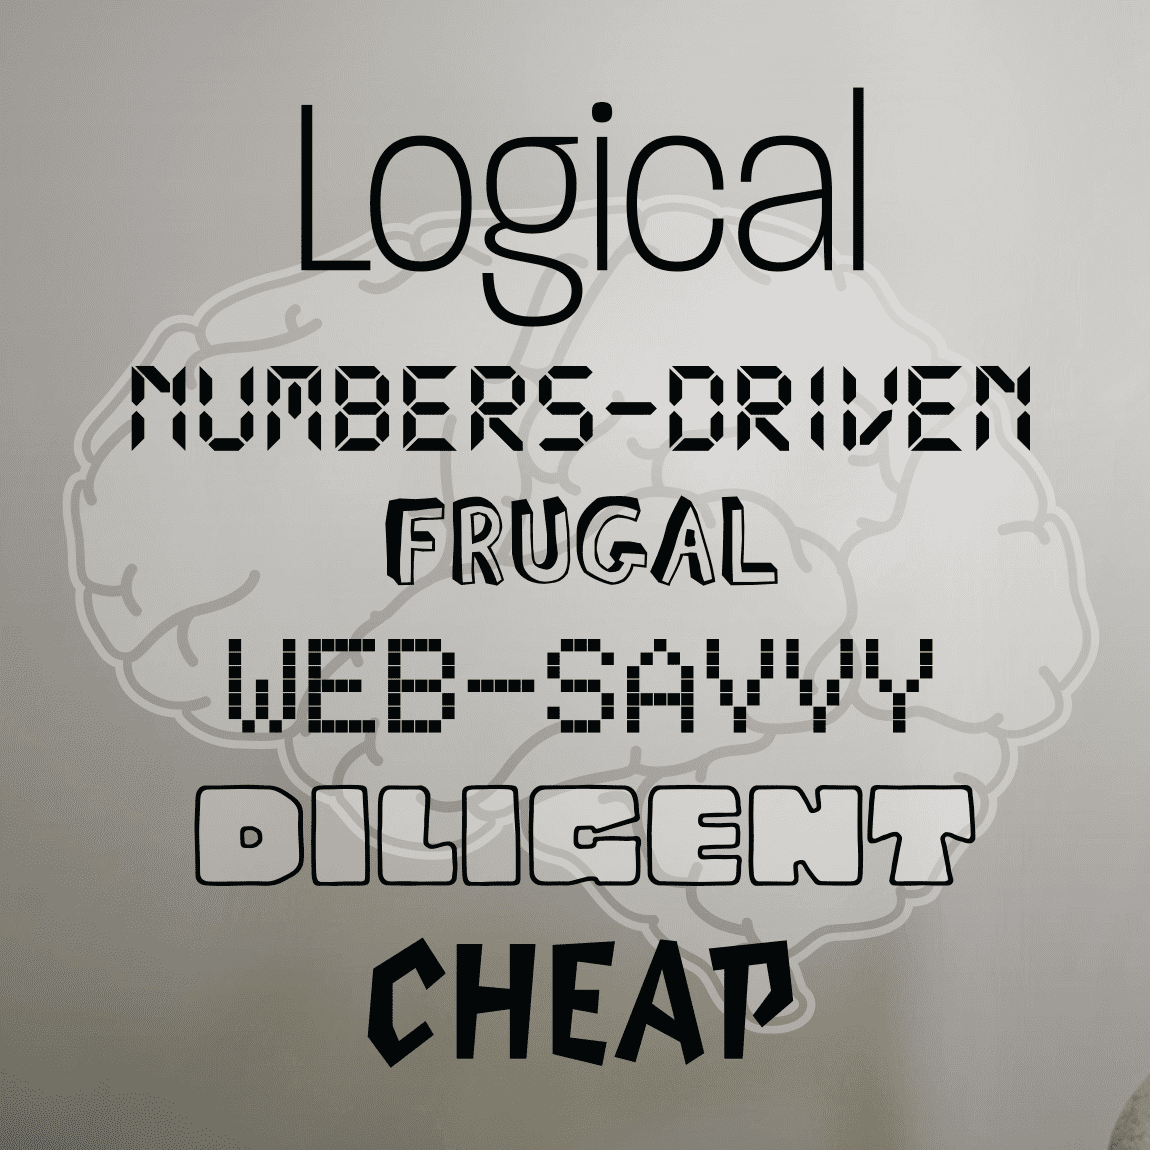
- Putting the supplementary image to serve the context should deliver the information implicitly.
- This adds a specific meaning to the contents conclusively.
- This is an effective visualization method for the qualitative data.
- e.g., two different background images on two groups of keywords cloud (Fig.3, 4)
- Data visualization
-
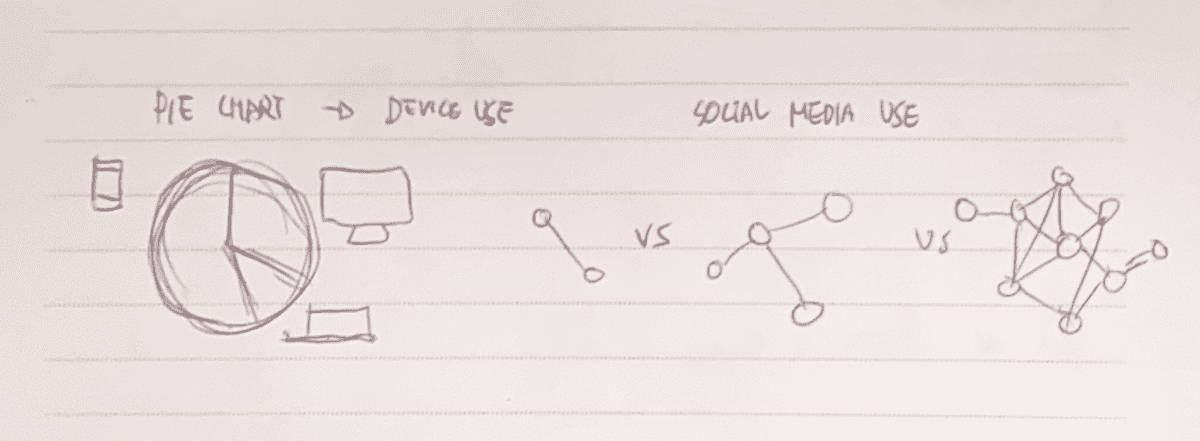
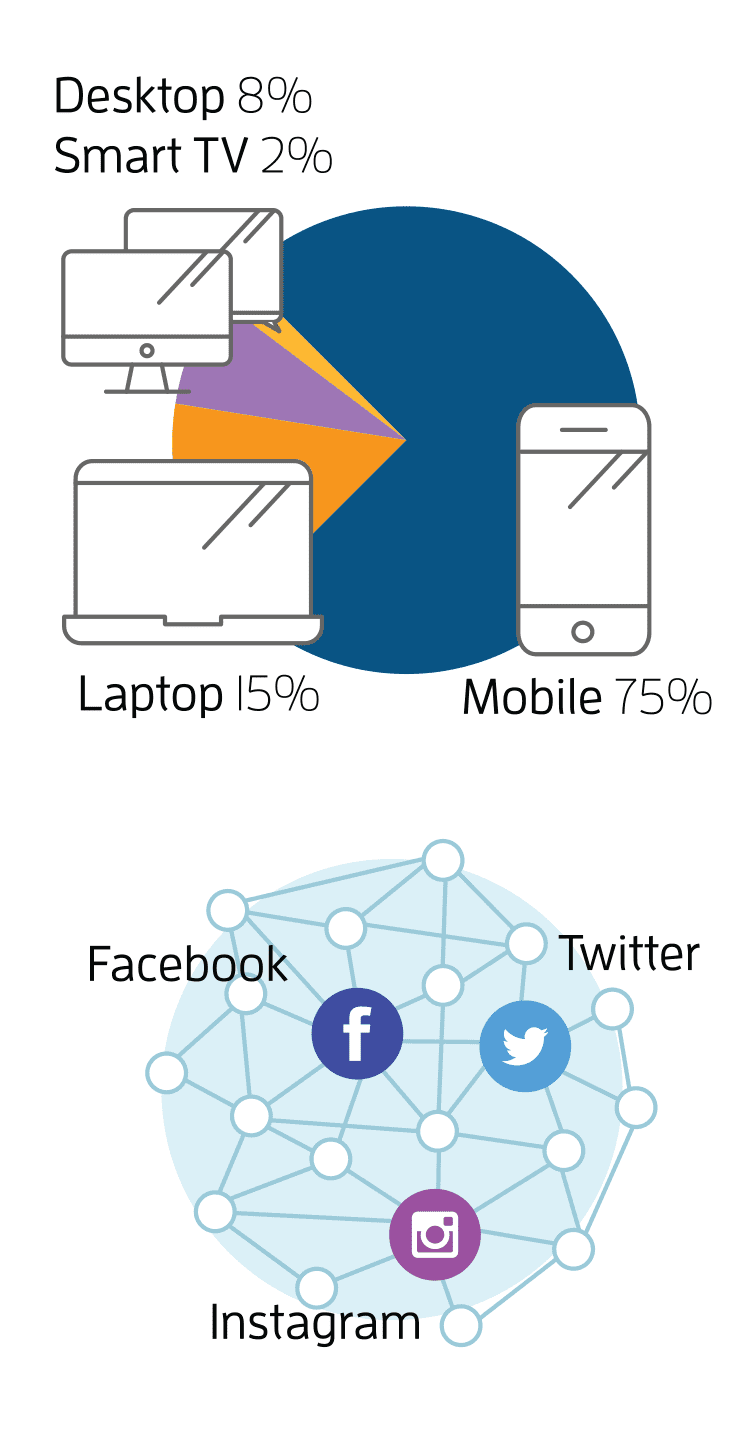
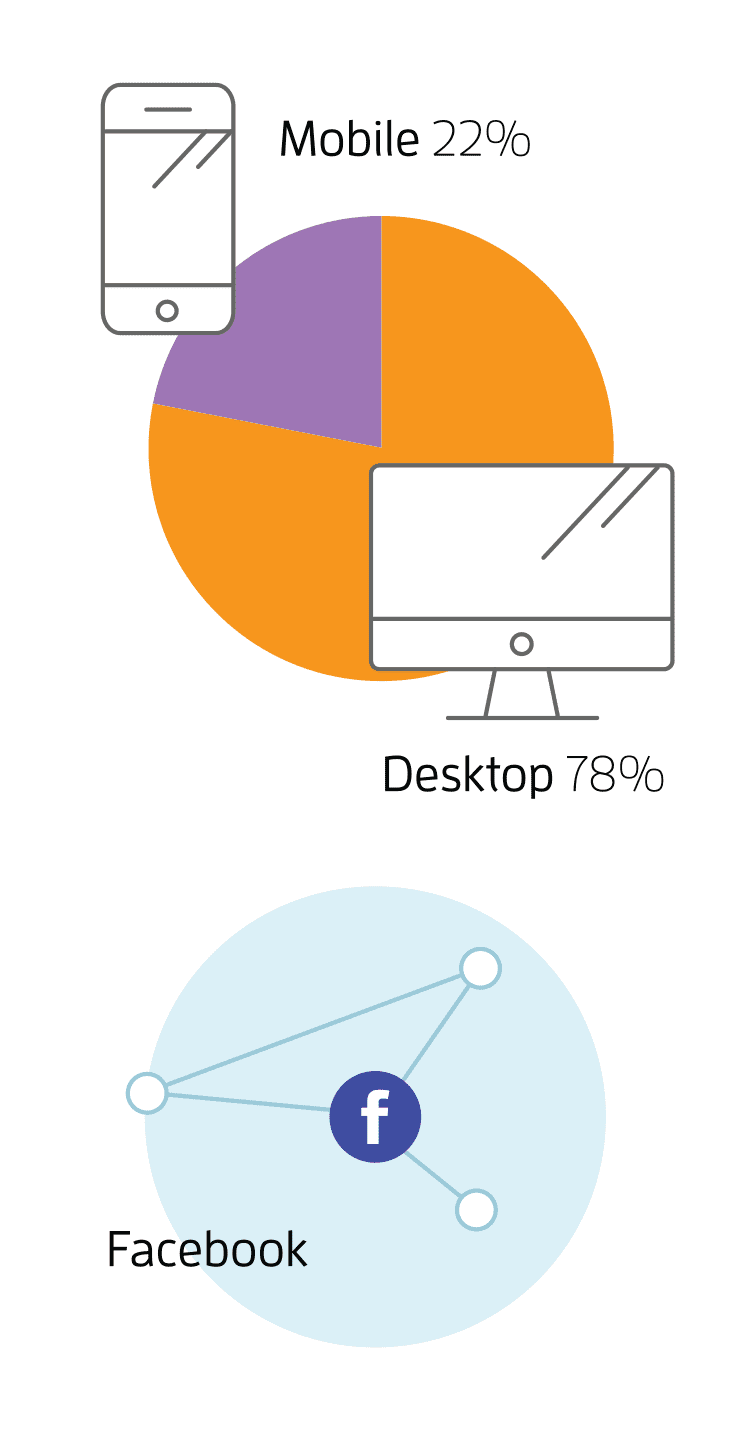
- This method would serve quantitative data well.
- If the data represents a specific number, the chart will serve the purpose. e.g., a pie chart - Fig.6
- If the data represents a trend, visual could be more contextual. e.g., social media usage - Fig.7
Final outcomes
- 4 primary personas, 3 secondary personas, and 1 persona of potential consumer
- Printed and presented by hanging on all meeting areas
- Evangelize the whole team to specify persona in the product-related conversation
Contribution
- Visual design
-
- Directing overall visual concept and layout of the persona poster
- Curating and visualizing information to present consistently and intuitively
- Setting the color code strategy for segmentation
- UX research
-
- Collaborating with UX researcher analyzing consumer data
- Collaborating with UX researcher searching internal data collection
